Visualization Comparison
Interactive Side-by-Side Analysis of Weather Patterns
Four Weather Visualizations
Click any visualization to zoom in for detailed analysis
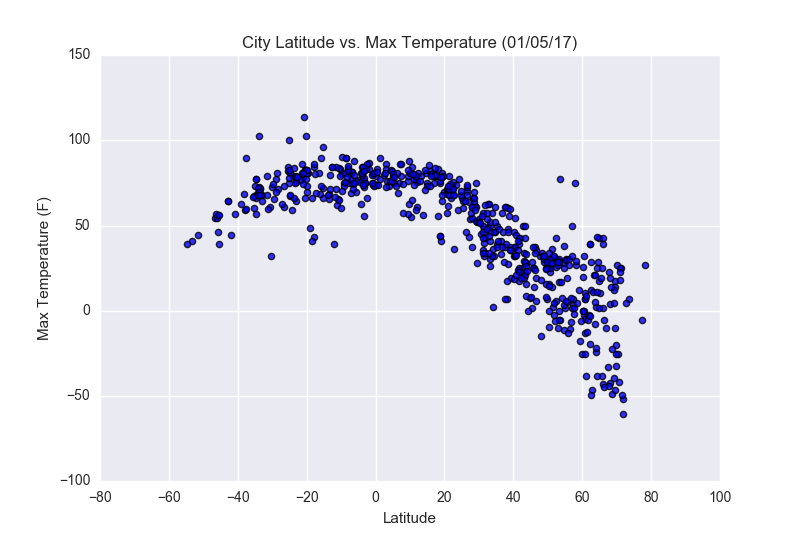
Correlation Strength: Strong
- Clear negative correlation in northern hemisphere
- Symmetric distribution around equator
- R² value: 0.84 (high correlation)
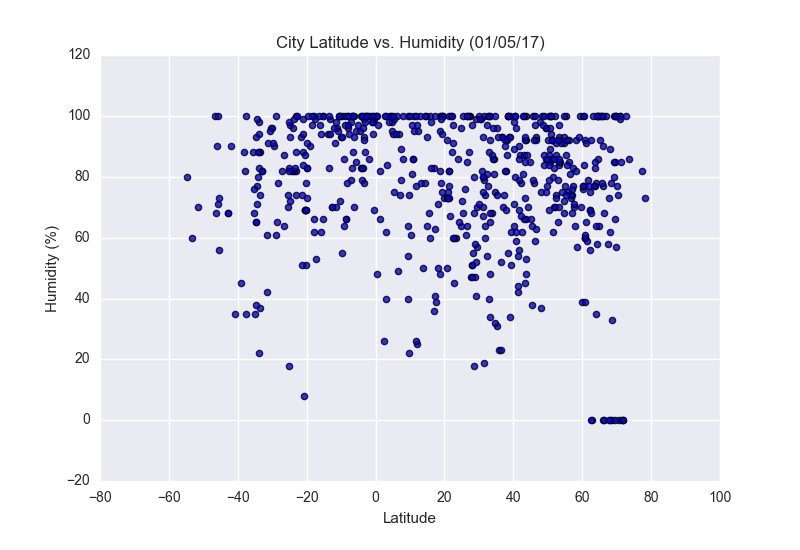
Correlation Strength: Weak
- High variability across all latitudes
- Tropical regions show consistently high humidity
- Desert regions create notable exceptions
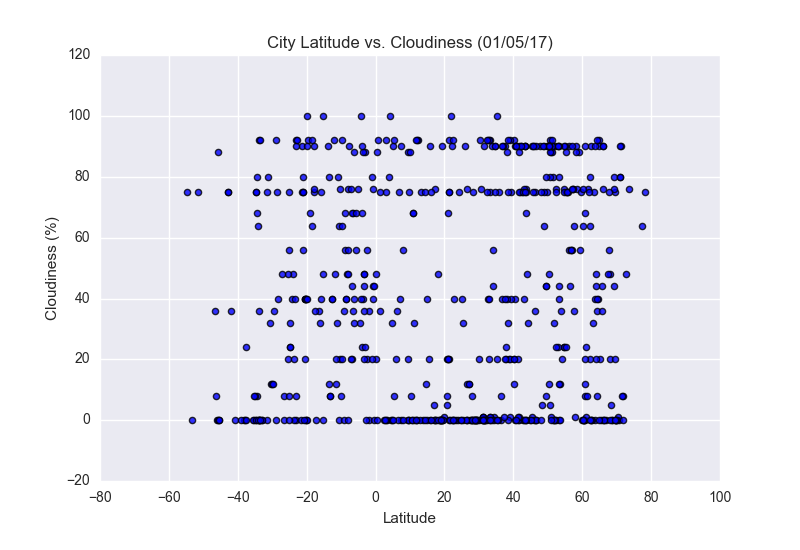
Correlation Strength: Very Weak
- Measurement clustering at specific percentages
- High variability at all latitudes
- Complex atmospheric influences dominate
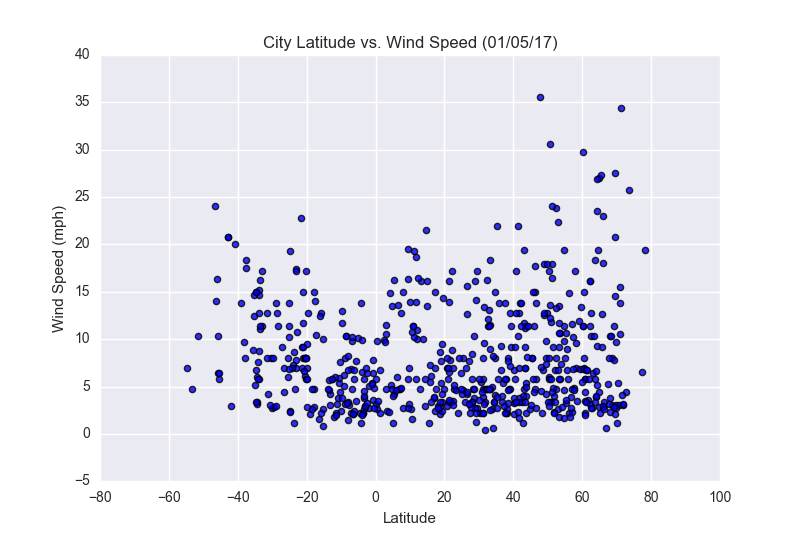
Correlation Strength: Moderate
- Most cities experience 0-15 mph winds
- Higher variability at extreme latitudes
- Calmer conditions near equator
Latitude vs. Max Temperature
Key Findings
- Temperatures increase as cities approach the equator (0° latitude)
- Strong negative correlation between latitude and temperature in northern hemisphere
- Temperature distribution is more symmetric around the equator
- Southern hemisphere shows less temperature variation
This scatter plot shows the relationship between latitude and maximum temperature. As expected, cities closer to the equator (0° latitude) experience higher temperatures, while temperatures decrease as we move toward the poles.
Visualization Gallery
Click any visualization to view detailed analysis
Max Temperature
Humidity
Cloudiness
Wind Speed
Statistical Comparison
The following statistics compare the correlation strength and statistical significance of each weather factor's relationship with latitude:
Key Insights
- Temperature shows the strongest correlation with latitude, with clear patterns of decreasing temperature as distance from the equator increases.
- Wind speed shows moderate correlation, with higher latitudes experiencing more variability due to atmospheric circulation patterns.
- Humidity displays weak correlation, indicating that local geographic features (proximity to water, elevation) have greater influence than latitude alone.
- Cloudiness shows very weak correlation, suggesting complex atmospheric dynamics that are not primarily driven by latitudinal position.
Research Implication: While latitude strongly influences temperature, other weather factors are more heavily influenced by local geography and atmospheric conditions, demonstrating the complexity of global climate patterns.