Can socio-economic indicators predict suicide rates?
The notebook machine_learning_analysis.ipynb trained five kinds of model on World Bank indicators. Only 58 countries had every indicator, so models were trained on about 40 and tested on 15–18.
New to statistics? Key terms in plain words
- Suicide rate per 100,000
- Deaths by suicide each year for every 100,000 people, so countries of different sizes can be compared.
- Population-weighted average
- An average where bigger countries count more, so it reflects the average person rather than the average country.
- Correlation (r)
- How closely two things rise and fall together, from −1 to +1. 0 means no link; around 0.3 is a moderate link and 0.5 or more a strong one. A correlation does not prove that one thing causes the other.
- p-value
- How likely a link this strong would appear by pure chance if there were really none. Below 0.05 is called statistically significant unlikely to be a fluke.
- 95% confidence interval (CI)
- The range the true value very probably lies in. A narrow range means a precise estimate.
- Controlling for / adjusted
- Taking another factor out of the comparison, so the link that remains is not just that factor in disguise.
- Mean vs median
- The mean is the ordinary average. The median is the middle value when everything is sorted, so a few extreme values don't pull it.
- Standard deviation (SD)
- The typical spread of a measure around its average. "Per SD" means comparing a country about one typical step above average with an average one.
- Odds ratio (OR, aOR)
- How much a factor multiplies the odds of something. 1 = no difference, 2 = double the odds, 0.5 = half. "Adjusted" (aOR) means the other factors are held constant.
- Within-country (fixed effects)
- Compares each country with itself over time, so fixed differences between countries culture, history, how deaths are recorded drop out.
- R²
- The share of the differences a model explains: 0 = nothing, 1 = everything. 0.17 means about a sixth.
- Cross-validation
- Testing a model on data it hasn't seen, by repeatedly holding back part of the data a fair test of how well it would really predict.
- AUC
- How well a model ranks people who did vs didn't seek treatment: 0.5 = coin toss, 1 = perfect.
- Target leakage
- When a model is fed information that partly contains the answer, making it look better than it really is.
Re-analysis: cross-validated on all countries
The original evaluation dropped every country with a missing indicator (183 → 58) and scored each model on one small test split. Here the indicators plus alcohol, health spending and World Bank region are evaluated on all 185 countries (2017–2019 averages) with median imputation and 10 × 5-fold cross-validation.
| Model | Cross-validated R² (mean ± sd) |
|---|
Original analysis · data preprocessing & correlation
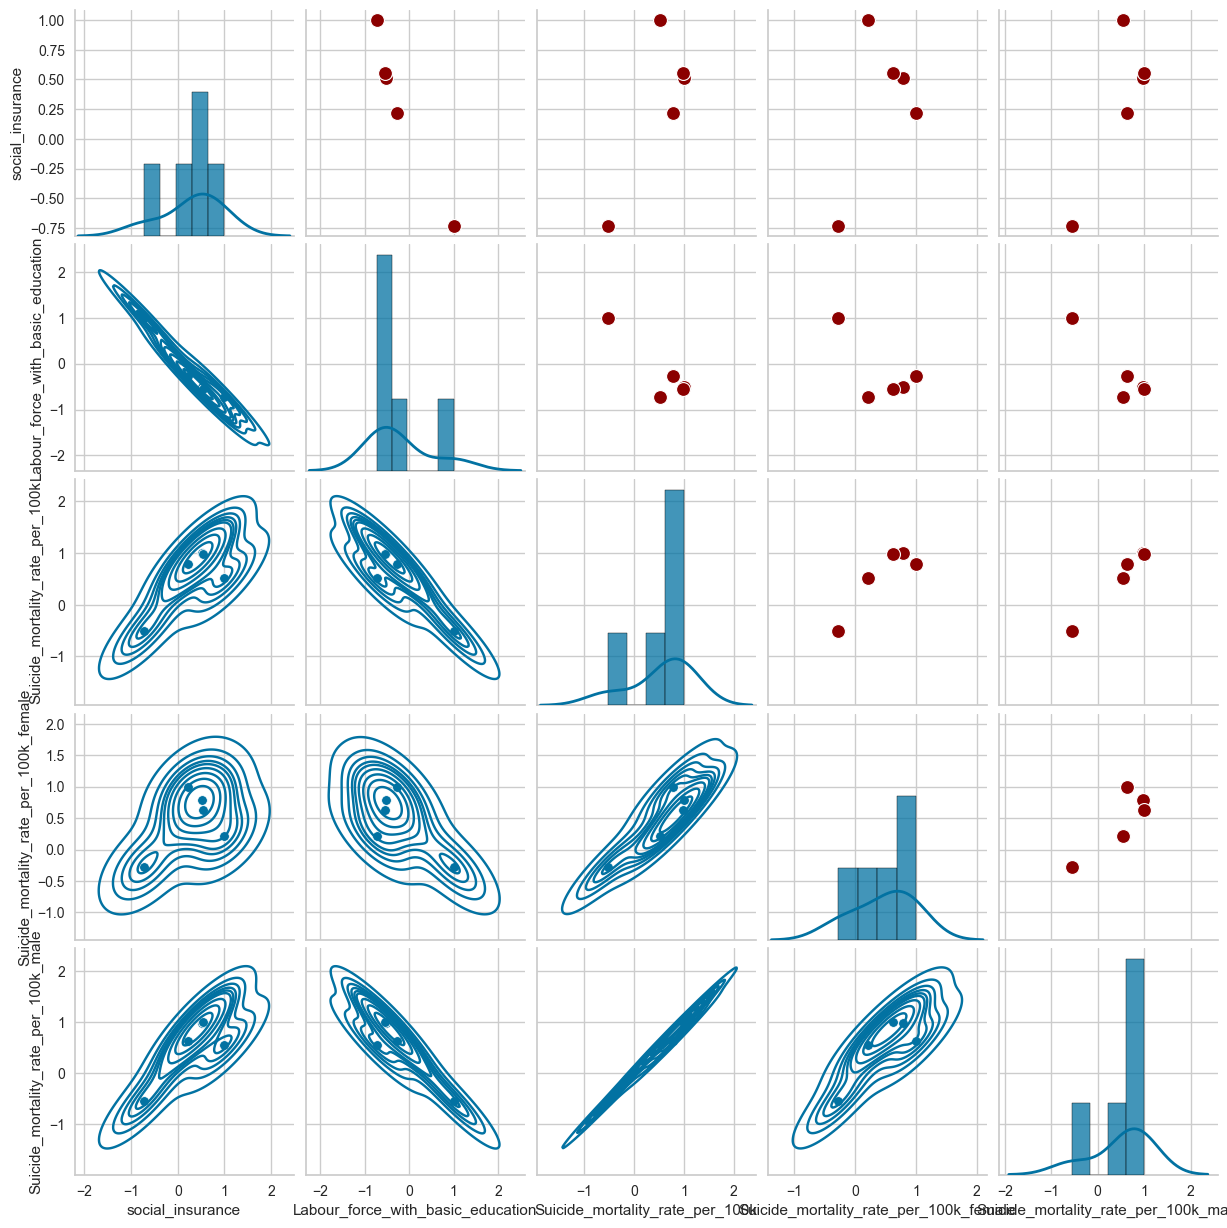
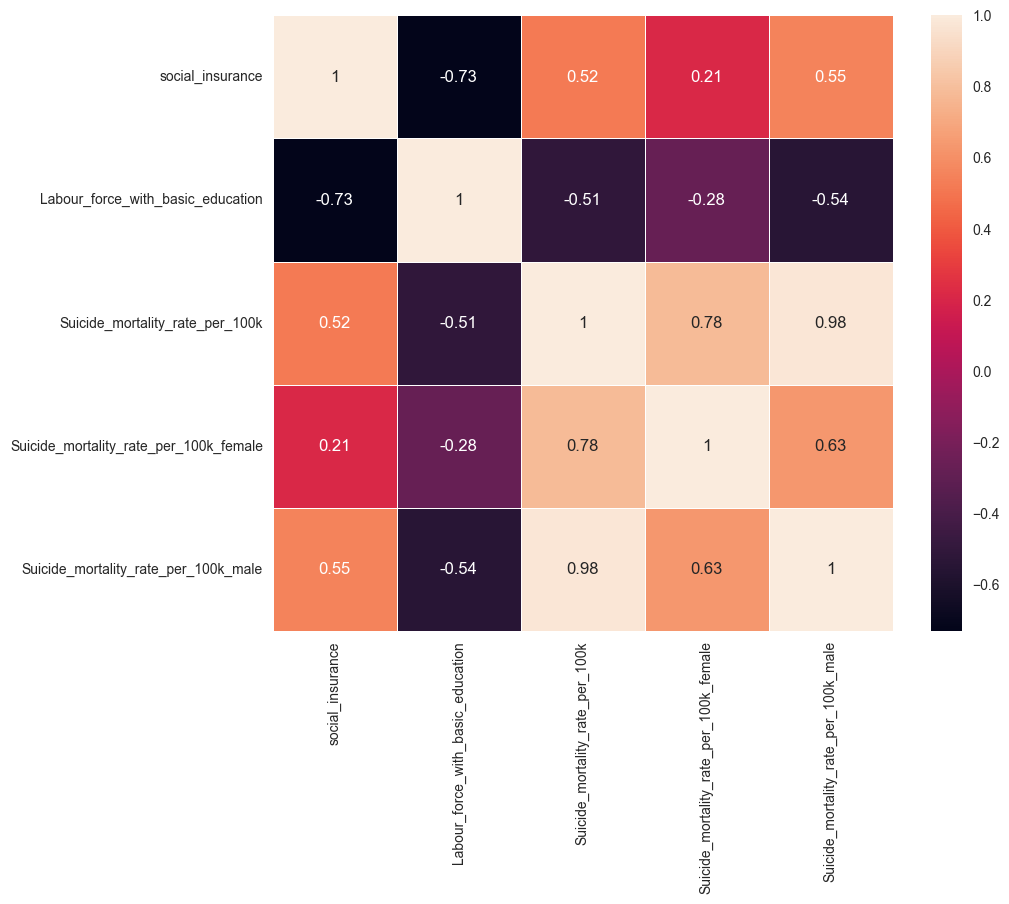
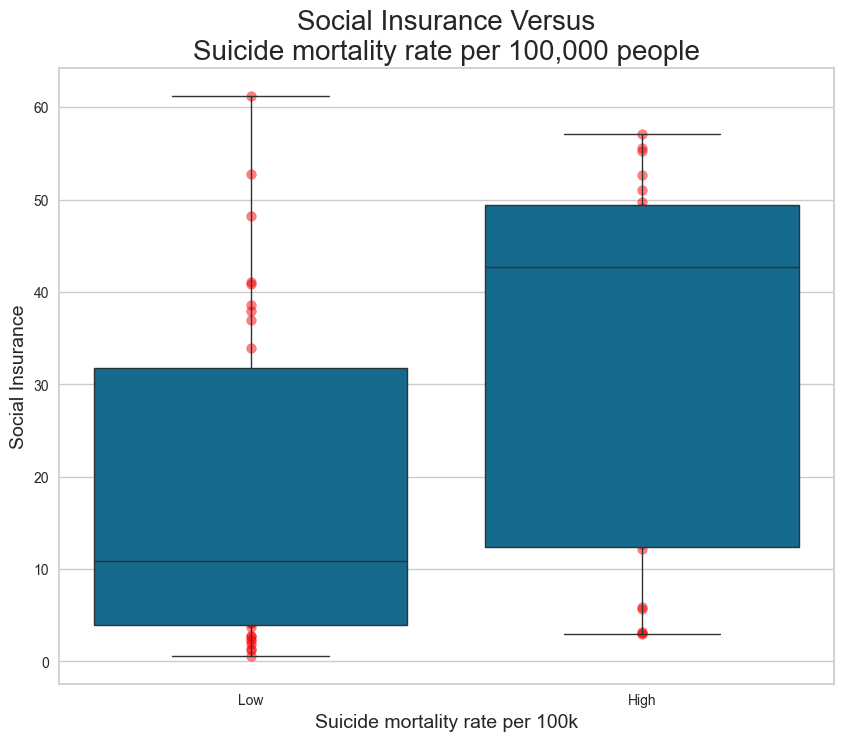
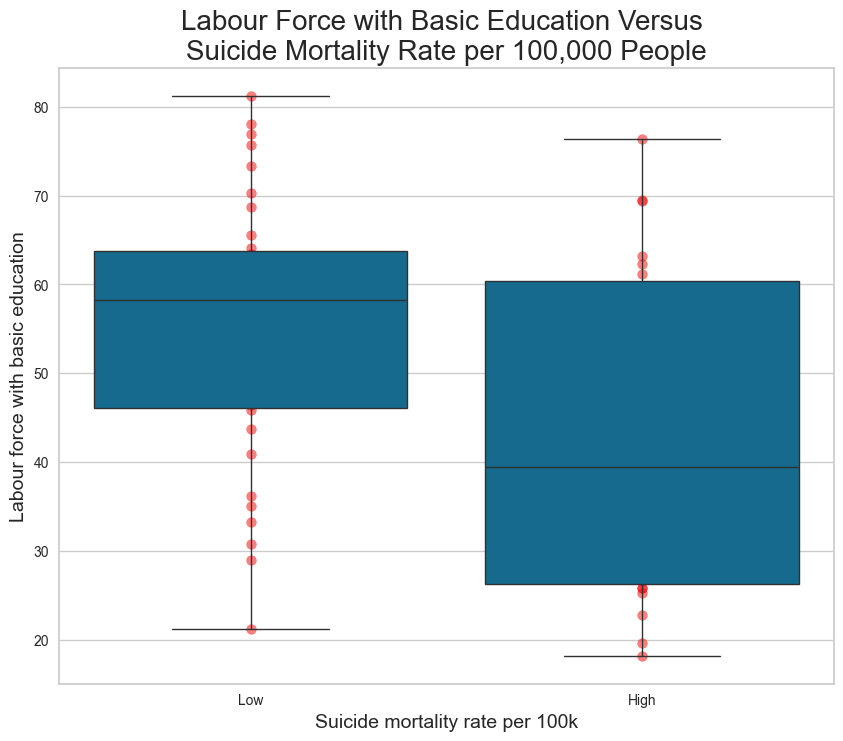
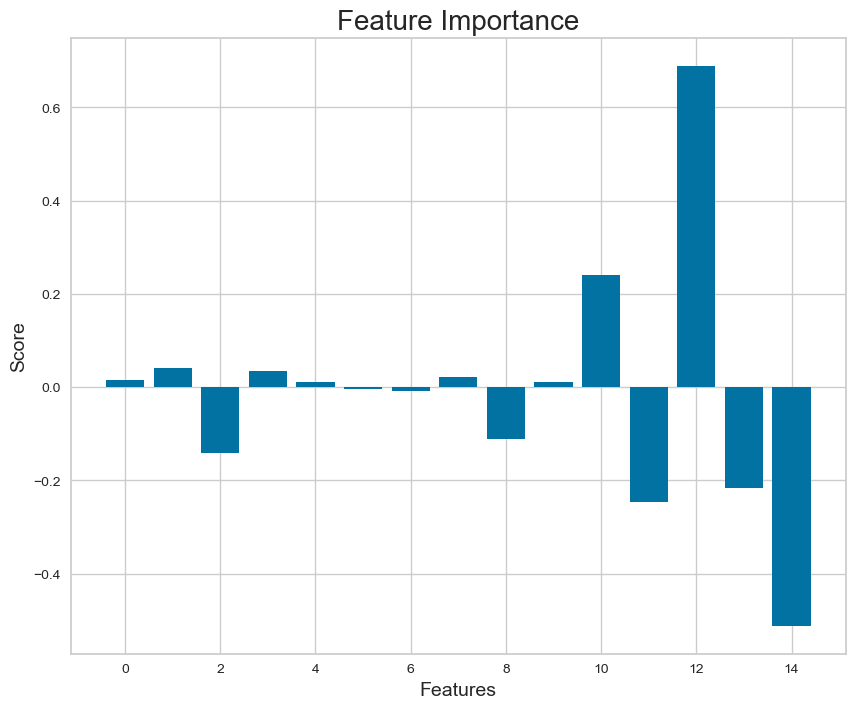
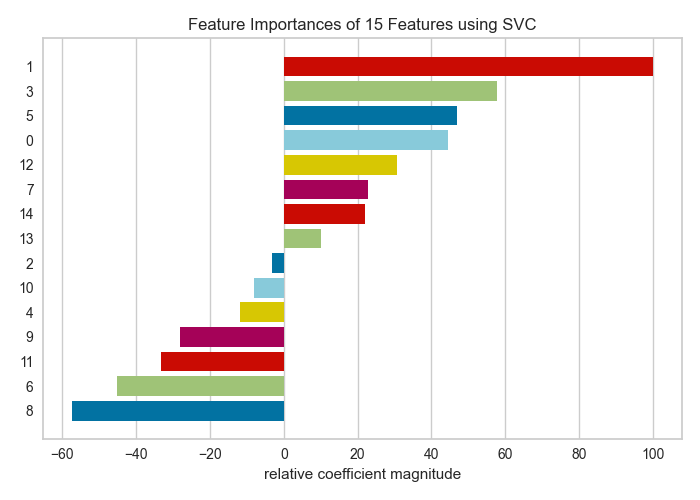
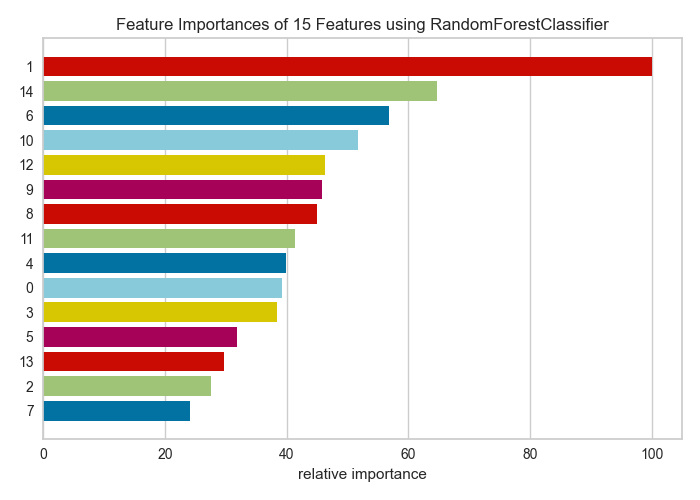
Before modelling, the data were cleaned, normalised and examined for correlations with the suicide mortality rate. The team reported a positive association with social-insurance coverage and a negative association with the basic-education labour-force indicator which measures how many people with only basic education are working, not the workforce's education level. On 2000–2021 data the labour-force link holds after controlling for region, while the social-insurance link is unstable (coverage data exist for only 45–64 countries; see the overview).
1 · Regression: predicting the rate
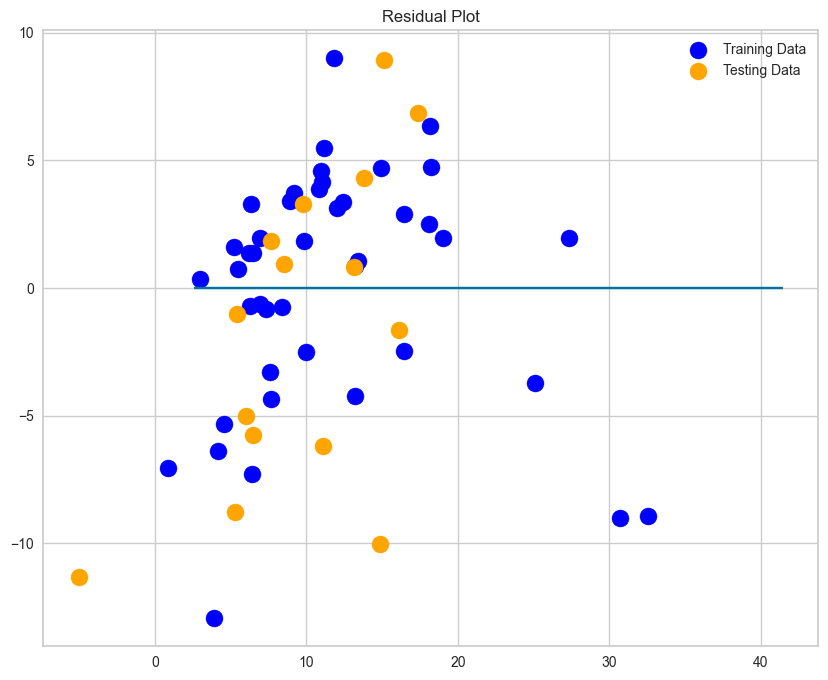
R² is the share of variation explained; a negative test R² means the model does worse on new countries than simply predicting the average.
| Model | Train R² | Test R² |
|---|
2 · Classification: high or low?
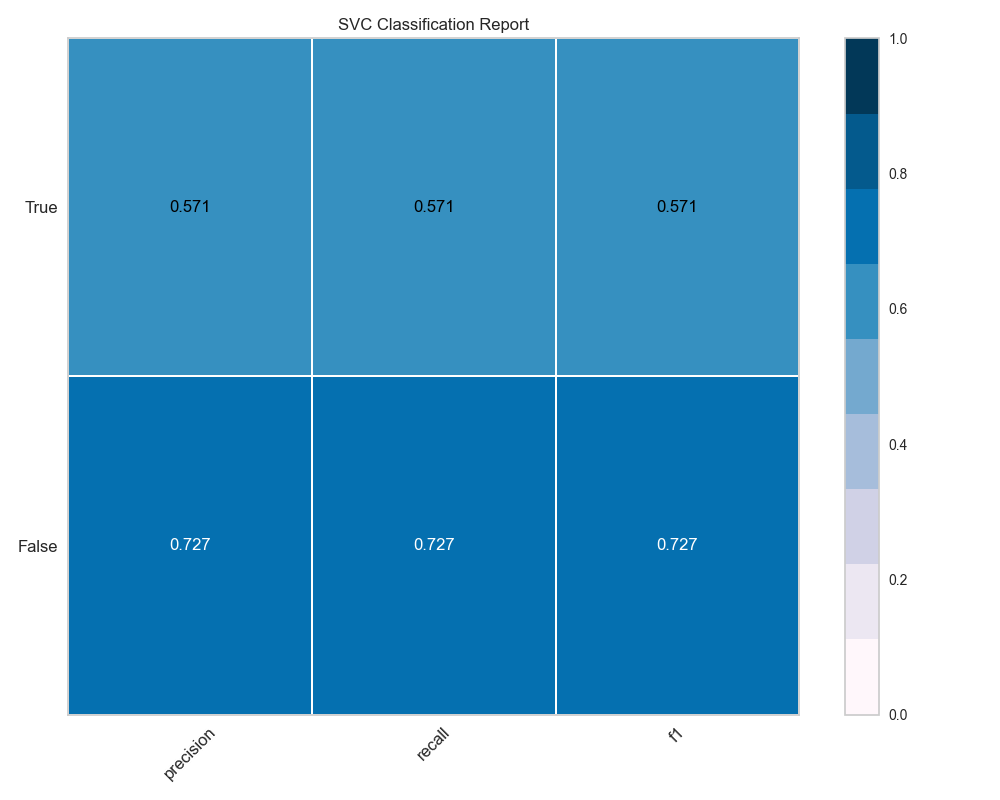
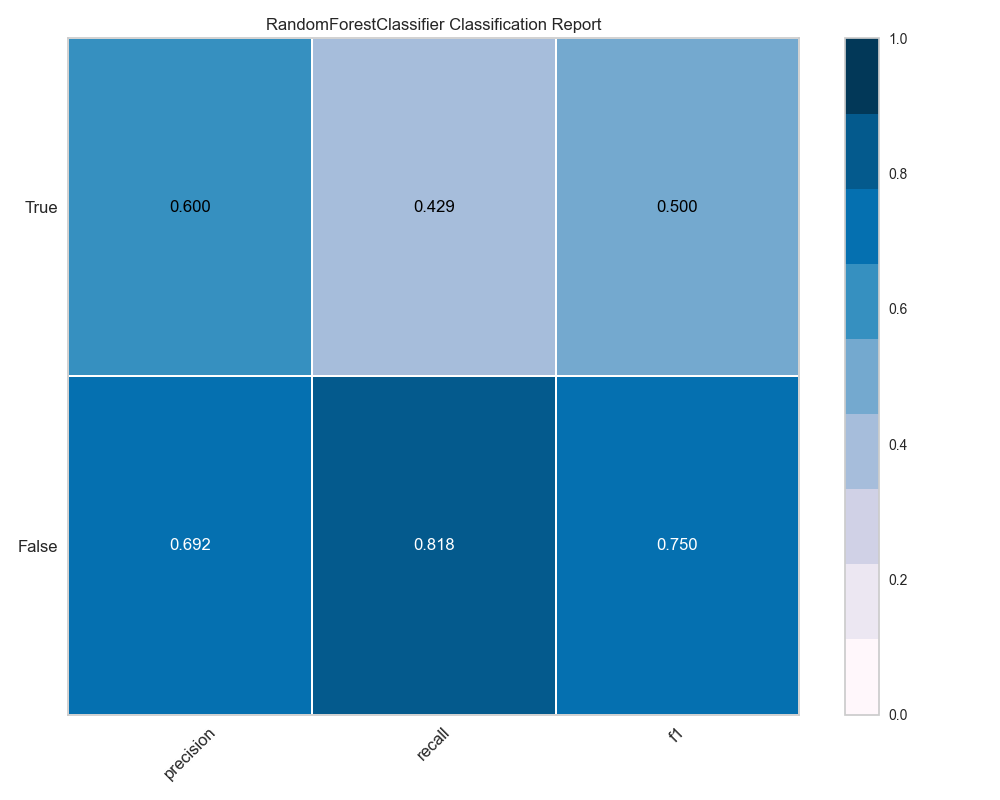
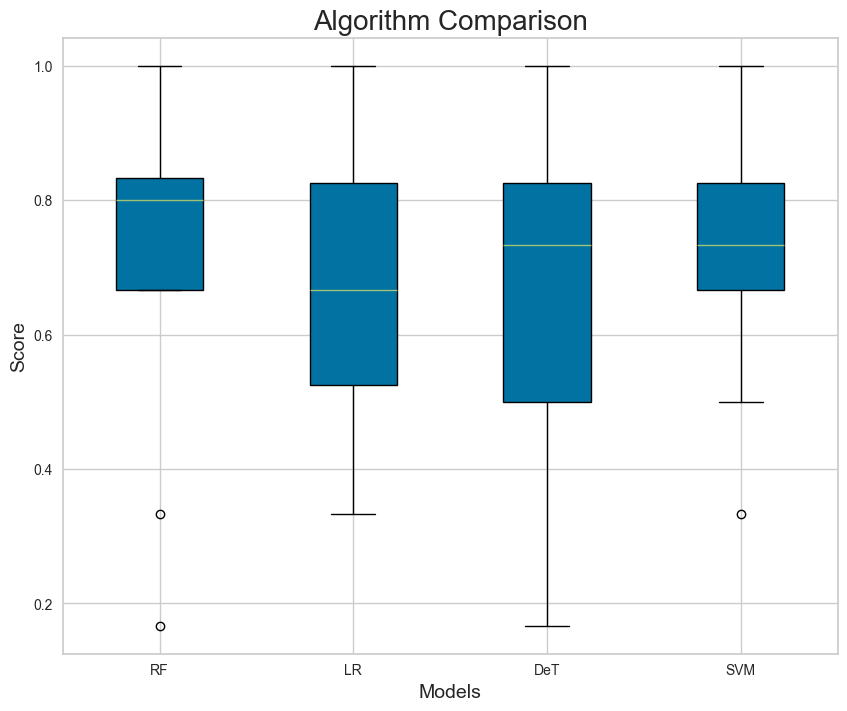
Countries above the mean (11.5 per 100,000) were labelled high. Test accuracy is on 18 held-out countries; cross-validated accuracy is the mean ± standard deviation across folds.
| Model | Train | Test | Cross-validated | F1 (high) |
|---|
What this means
- Overfitting
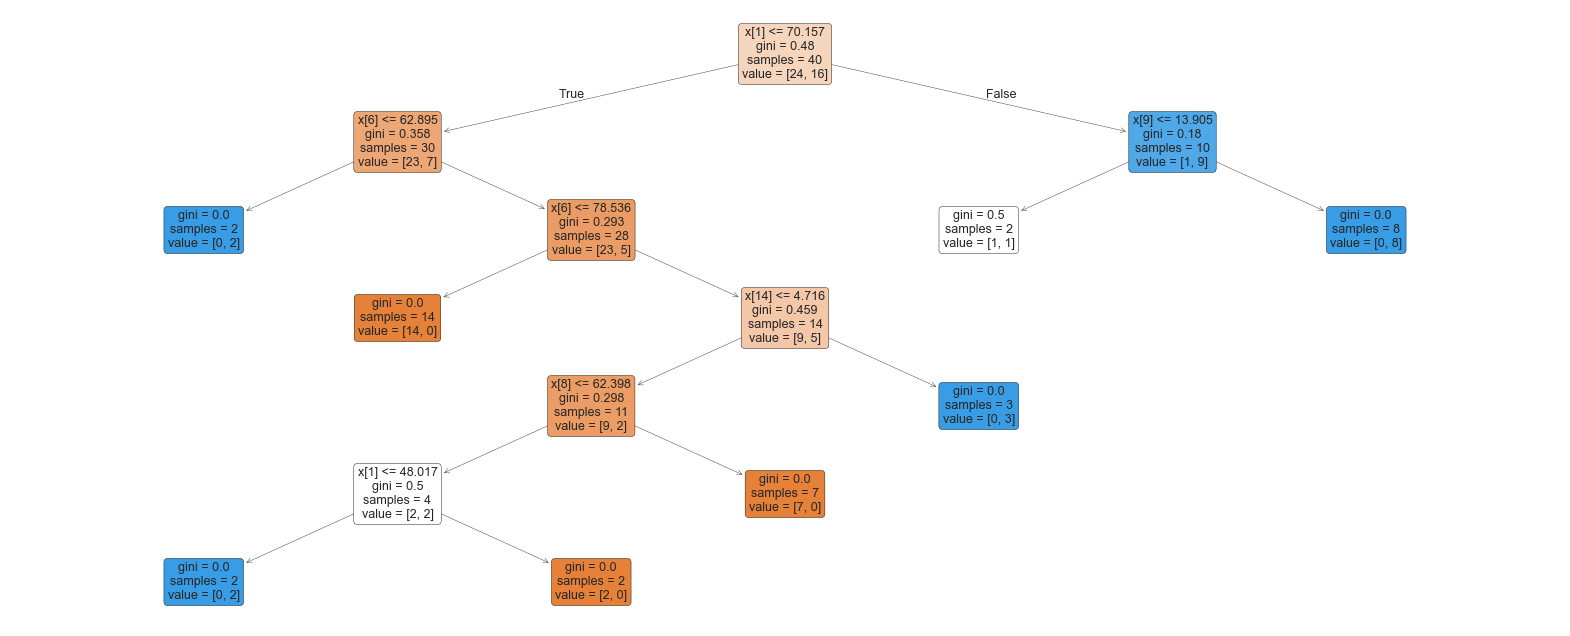
Trees and forests scored 98–100% on training countries but 61–72% on new ones they memorised the 40 training countries.
- Barely above a naive guess
Always predicting "low" scores 61% on the test set; the best models add about 11 points, and cross-validation varies by ±18–24 points, so the difference isn't reliable.
- Too little data
Requiring every indicator cut 183 countries to 58. Imputation, fewer features, or regional controls would be better next steps than more complex models.
- The useful output is descriptive
The indicator correlations show which patterns exist; they can inform where prevention resources are studied further, not predict outcomes.