What can data tell us about mental health and suicide risk?

Two views of the same question: who seeks treatment in a survey of 1,258 tech workers, and how suicide rates in 185 countries changed from 2000 to 2021 and what goes with them income, alcohol, education and employment with an honest look at what machine learning can and can't predict.

PythonPandasscikit-learnTableauWorld Bank WDIOSMI surveyChart.js
1,258Survey respondents
51%Have sought treatment
185Countries, 2000–2021
2.9×Male vs female suicide rate

Key findings

What the data shows

Each finding in plain words first, with the statistics behind it underneath (full analysis: tools/analyze.py).

    New to statistics? Key terms in plain words
    Suicide rate per 100,000
    Deaths by suicide each year for every 100,000 people, so countries of different sizes can be compared.
    Population-weighted average
    An average where bigger countries count more, so it reflects the average person rather than the average country.
    Correlation (r)
    How closely two things rise and fall together, from −1 to +1. 0 means no link; around 0.3 is a moderate link and 0.5 or more a strong one. A correlation does not prove that one thing causes the other.
    p-value
    How likely a link this strong would appear by pure chance if there were really none. Below 0.05 is called statistically significant unlikely to be a fluke.
    95% confidence interval (CI)
    The range the true value very probably lies in. A narrow range means a precise estimate.
    Controlling for / adjusted
    Taking another factor out of the comparison, so the link that remains is not just that factor in disguise.
    Mean vs median
    The mean is the ordinary average. The median is the middle value when everything is sorted, so a few extreme values don't pull it.
    Standard deviation (SD)
    The typical spread of a measure around its average. "Per SD" means comparing a country about one typical step above average with an average one.
    Odds ratio (OR, aOR)
    How much a factor multiplies the odds of something. 1 = no difference, 2 = double the odds, 0.5 = half. "Adjusted" (aOR) means the other factors are held constant.
    Within-country (fixed effects)
    Compares each country with itself over time, so fixed differences between countries culture, history, how deaths are recorded drop out.
    R²
    The share of the differences a model explains: 0 = nothing, 1 = everything. 0.17 means about a sixth.
    Cross-validation
    Testing a model on data it hasn't seen, by repeatedly holding back part of the data a fair test of how well it would really predict.
    AUC
    How well a model ranks people who did vs didn't seek treatment: 0.5 = coin toss, 1 = perfect.
    Target leakage
    When a model is fed information that partly contains the answer, making it look better than it really is.

    Background

    Why this matters

    Suicide remains a significant global public-health concern: the World Health Organization estimates about 800,000 people die by suicide each year, with substantial variation across countries and over time, and many more experience suicidal ideation or attempts.

    Research identifies two broad domains associated with suicide mortality at the population level: structural and socio-economic conditions income, education, employment and social protection and mental-health factors such as the prevalence of mental disorders and access to care (Li et al., 2011). This project examines both.

    Research question. Which population-level socio-economic and mental-health indicators are most strongly associated with national suicide mortality rates, and how can data-driven methods help identify patterns relevant to suicide-prevention planning?

    This is population-level analysis. It does not predict individual risk or support clinical decisions.

    World map · 2017–2019 average

    Suicide rates around the world

    World Bank suicide mortality (deaths per 100,000) and related indicators, plus each country's change since 2000. Pick a measure; click a country for its 22-year trend.

    Workplace survey

    Who seeks treatment?

    Share of OSMI Mental Health in Tech respondents (2014–2016) who have sought treatment for a mental-health condition, by their answer to another question. Pick a question.

    In plain words. About half of the 1,258 tech workers surveyed had sought treatment for a mental-health condition. Pick a question to see how that share changes for example, 74% of people with a family history of mental illness had been treated, against 35% without one.

    Adjusted for everything else: what independently predicts treatment?

    In plain words. Many answers overlap people with a family history may also have better benefits. This chart weighs every factor at once. Dots to the right of the line raise the odds of having sought treatment, dots to the left lower them; a bar crossing the line means no clear effect.

    185 countries · 2017–2019 average

    How do national suicide rates relate to social and economic conditions?

    World Bank suicide rates (deaths per 100,000) against social and economic indicators. Each point is a country.

    In plain words. Suicide rates differ a lot between world regions, so a fair test compares each country with others in its own region. Alcohol, income, education and health spending are still linked to suicide rates after that but these links describe countries, not individuals, and don't prove cause.

    By world region

    Against a socio-economic indicator

    Highest suicide rates

      Lowest suicide rates

        Does each association survive controlling for region?

        Association of each indicator with national suicide rates, raw and adjusted for world region
        IndicatorCountriesEffect, all countriesEffect within regionCheck: 2015–16 data
        Calculating…

        Within countries: do rates move with a country's own changes?

        In plain words. Instead of comparing countries with each other, this compares each country with itself over time: when a country gets richer or drinks more, does its suicide rate change?
        Two-way fixed-effects estimates of within-country associations, 2000–2021
        Change in…Effect on suicide per 100k [95% CI]p-valueCountries

        Why region matters. Social-insurance coverage correlates with higher suicide rates not because insurance causes harm, but because both are high in former Soviet states, which share history, alcohol policy and economic shocks. Very low rates in small island states and conflict zones may also reflect under-reporting.

        Prediction

        Can these indicators predict a country's suicide rate?

        Re-analysis on all 185 countries (2017–2019 averages) with repeated 5-fold cross-validation replacing the original single split of 58 countries.

        In plain words. Could a model estimate a country's suicide rate from these indicators alone? Tested fairly, on countries it hadn't seen, it explains less than a fifth of the differences so the indicators help describe patterns but can't predict a country's rate.
        Cross-validated R² by model
        ModelCross-validated R²
        Verdict. The indicators explain under a fifth of the variation between countries little more than knowing the region. A random forest does no better than a regularised linear model, a sign there isn't enough signal for a flexible model to exploit. The original classifiers' 72% test accuracy came from 18 countries against a 61% always-"low" baseline. Full model results →

        Data quality

        Corrections made in this version

        Fixes are scripted in tools/clean_data.py and tools/build_static.py.

        Excel datesFixed

        Company sizes "1-5" and "6-25" had been turned into the dates "05-Jan" and "25-Jun" in 452 responses.

        Impossible agesFixed

        Ages such as −1726, 5, 329 and 99,999,999,999 (8 respondents) are treated as missing; one duplicate response was removed.

        Mixed-in aggregatesFixed

        46 World Bank rows like "World", "High income" and "Euro area" sat alongside the 217 countries and would double-count in any country statistic.

        Overstated claimsCorrected

        The old pages cited "200+ countries, 14 years", WHO data and "strong protective effects of healthcare access" none of which the data contains. All figures are now calculated from the data.

        How it was done

        Methodology

        1. Collect

          OSMI Mental Health in Tech survey (Kaggle) and World Bank World Development Indicators 2000–2021 (tools/fetch_external.py).

        2. Clean

          Reshaped the World Bank export with Pandas, fixed data errors and separated countries from aggregates.

        3. Explore

          Tableau dashboards and correlation analysis see the dashboards.

        4. Analyse

          Odds ratios and logistic regression (survey); region-adjusted and within-country fixed-effects regressions, cross-validated models (countries) tools/analyze.py.
        Indicators examined

        Socio-economic & structural (World Bank WDI)

        • Economic development (GDP per capita)
        • Alcohol consumption and government health spending
        • Labour-force participation and employment, by sex and education level
        • Primary-school completion; social insurance coverage
        • Life expectancy and population

        Mental health & workplace (OSMI survey)

        • Treatment and family history
        • Insurance coverage, benefits and care options
        • Workplace openness, stigma and consequences of disclosure
        • Wellness programmes and medical leave
        • Organisation size, remote work and tech-industry context
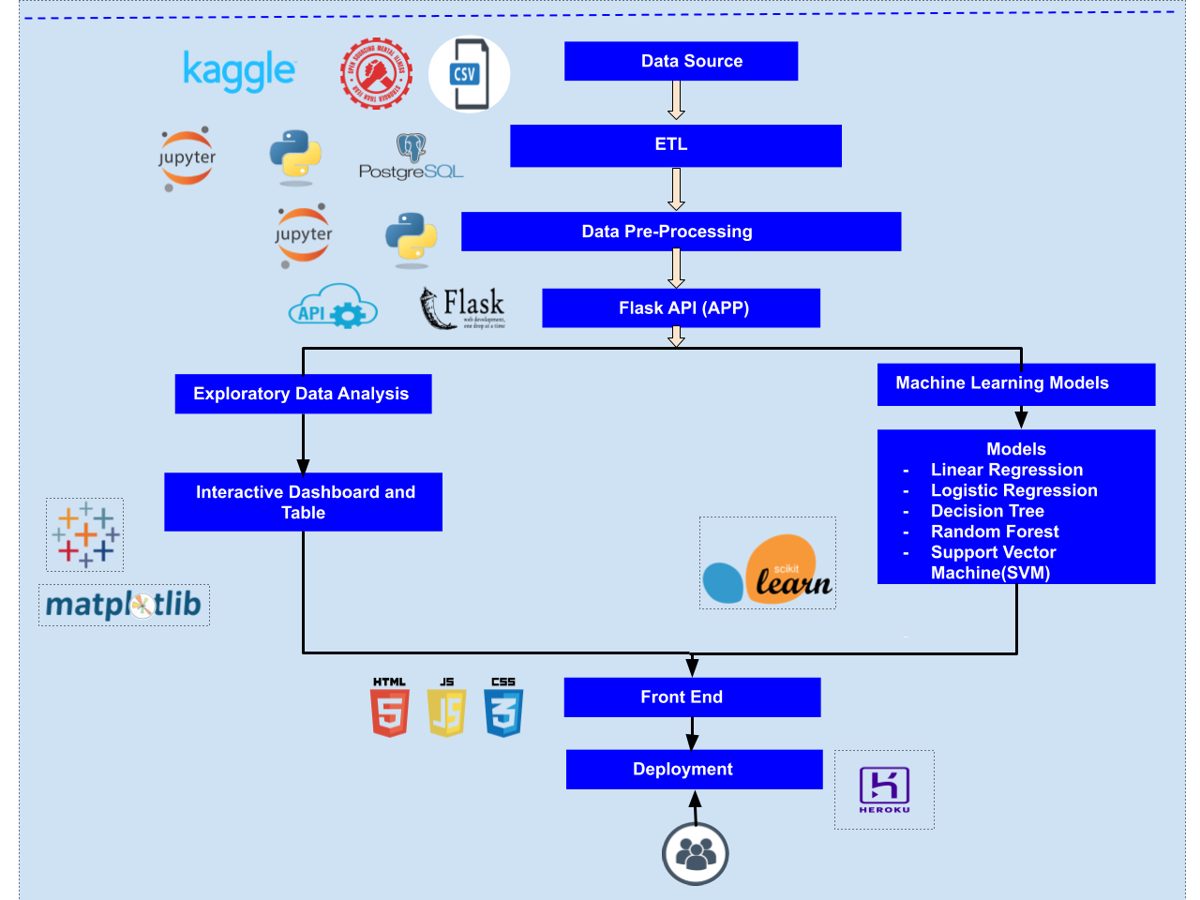
        System architecture: data sources, Python cleaning, database, Flask API and web front end with Tableau dashboards
        Original system architecture.
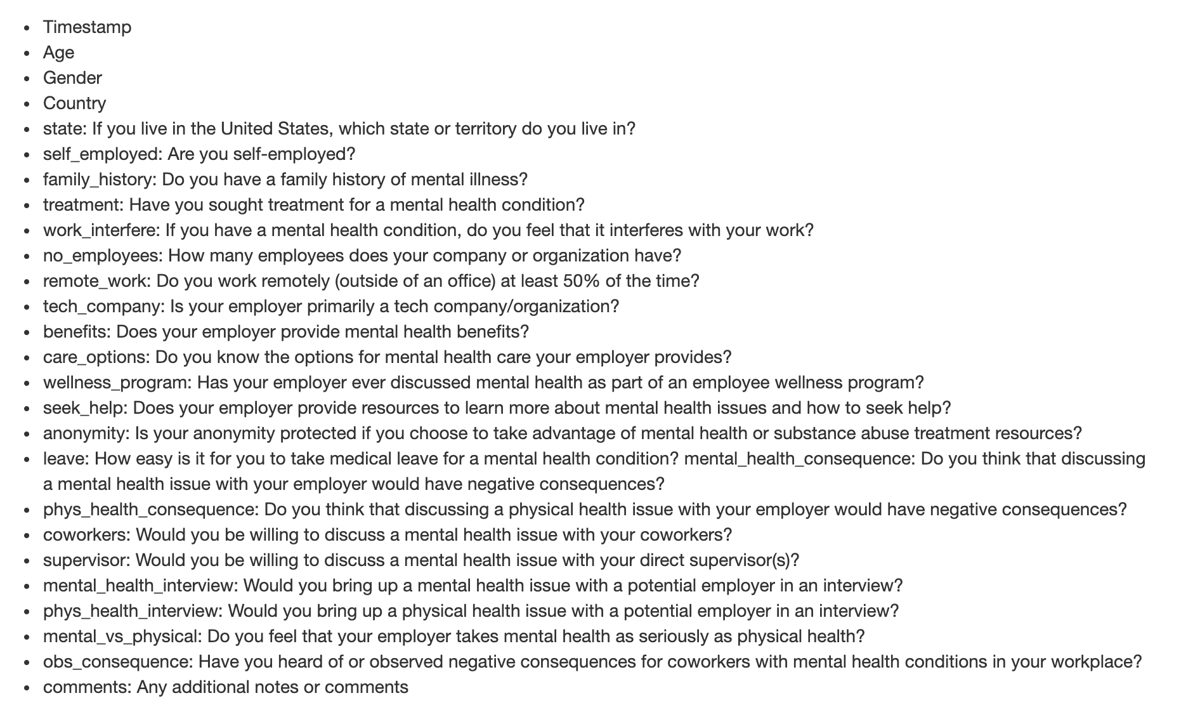
        Data map showing the survey and World Bank fields used
        Data map of the two sources.

        The team

        References

        1. Ferretti, F., & Coluccia, A. (2009). Socio-economic factors and suicide rates in European Union countries. Legal Medicine, 11.
        2. Li, Z., Page, A., Martin, G., & Taylor, R. (2011). Attributable risk of psychiatric and socio-economic factors for suicide. Social Science & Medicine, 72(4), 608–616.
        3. Szanto, K. (2017). Cognitive deficits as contributors to suicide. American Journal of Geriatric Psychiatry, 25(6), 630–632.
        4. World Bank (2020). World Development Indicators.
        5. World Health Organization (2019). Suicide fact sheet.
        Need to talk? If you or someone you know is struggling, help is free and confidential: call or text 988 in the US and Canada, call Samaritans on 116 123 in the UK and Ireland, or find a line in your country at findahelpline.com.