Regreression Plot Mouse Weight Vs. Average Tumor Volume
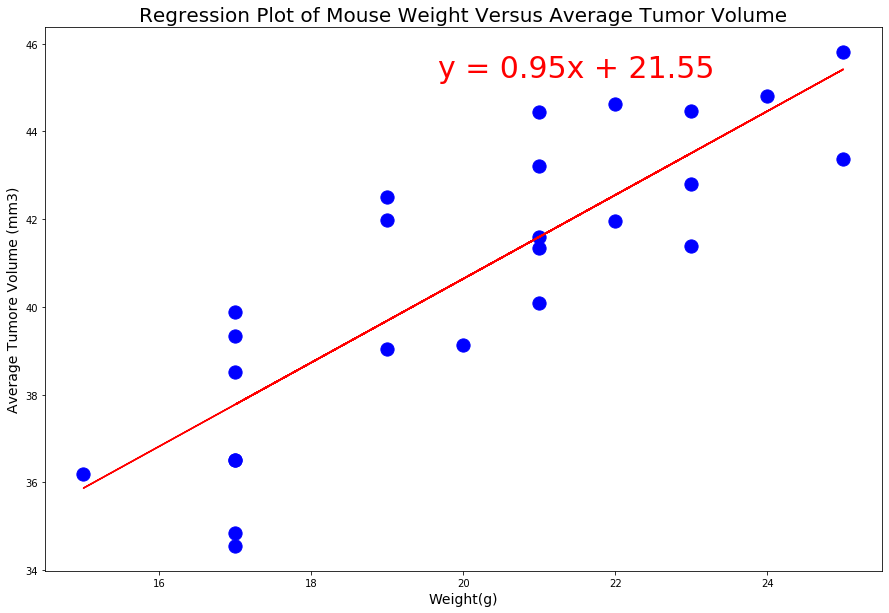
The regression analysis helped us to understand how much the average tumor volume (dependent variable) will change when weight of mice change(independent variables). The R-squared value is 0.70, which means 70% the model fit the data, wich is fairely good to predict the data from the model. Higher R-squared values represent smaller differences between the observed data, and the fitted value. 70% the model explains all of the variation in the response variable around its mean.


Visualizations