Hello, my name is Ermias Gelaye Gaga. I am a data scientist and data research analyst with over
10 years of experience working in fast-paced, dynamic digital environments with a strong focus
on data handling and analysis.
I hold a Master of Science in Data Science from
Eastern University,
Master of Science in Cognitive Science – Cognitive Neuroscience Stream from
CIMeC – Center for Mind/Brain Sciences at the University of
Trento,
and a Certificate in Data Analytics and Visualization from the
University of Toronto School of Continuing Studies.
I am passionate about leveraging my multidisciplinary training to collaborate with teams of
researchers focused on mining, analyzing, visualizing, and delivering insights from
heterogeneous data sources.
I've worked on a variety of data projects involving exploratory data analysis, visualization,
and the development of data pipelines. I showcase some of these projects on this site, with
links to their GitHub repositories.
When I'm not working with data, I enjoy photography and traveling. Check out my photography portfolio.

Expert-level proficiency with Pandas, NumPy, Scikit-learn, TensorFlow
Advanced statistical analysis, data visualization with ggplot2
Enterprise applications, backend systems, and data processing
Database design, query optimization, and complex data operations
Cleaning, transforming, and preparing data for analysis using Pandas, NumPy, and specialized tools.
Creating insightful visualizations with Matplotlib, Seaborn, Plotly, Tableau, and D3.js.
Statistical analysis, hypothesis testing, regression modeling, and advanced analytics.
Pattern recognition, clustering, classification algorithms, and machine learning applications.
Predictive modeling, machine learning algorithms, and model validation techniques.
Data exploration, feature analysis, pattern discovery, and initial insights generation.

Developed an interactive dashboard to explore online search trends for common health issues in the US over two decades, comparing them with actual occurrence data from CDC.

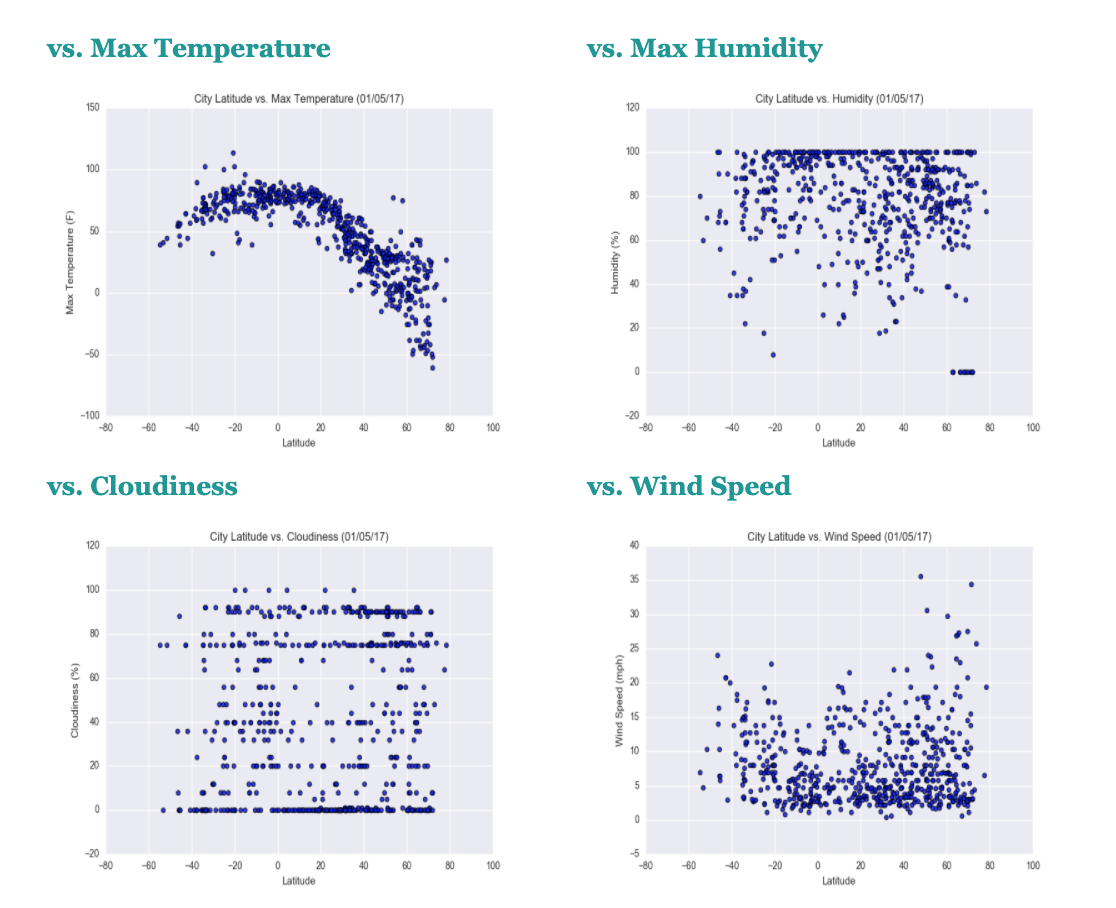
Analyzed how weather changes as you get closer to the equator using data from 500+ cities worldwide with comprehensive data collection and visualization techniques.

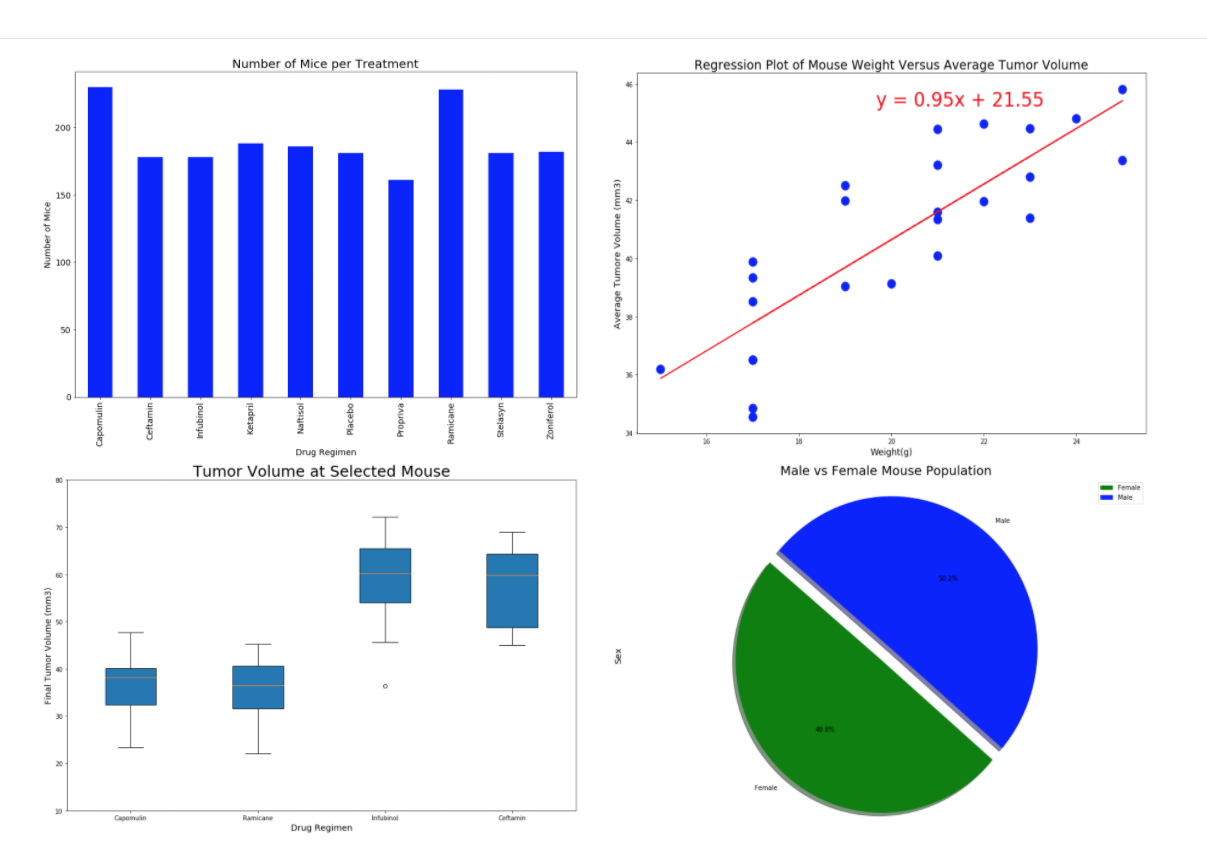
Analyzed data from 249 mice with SCC tumor growth to compare performance of different drug regimens using statistical methods and hypothesis testing.

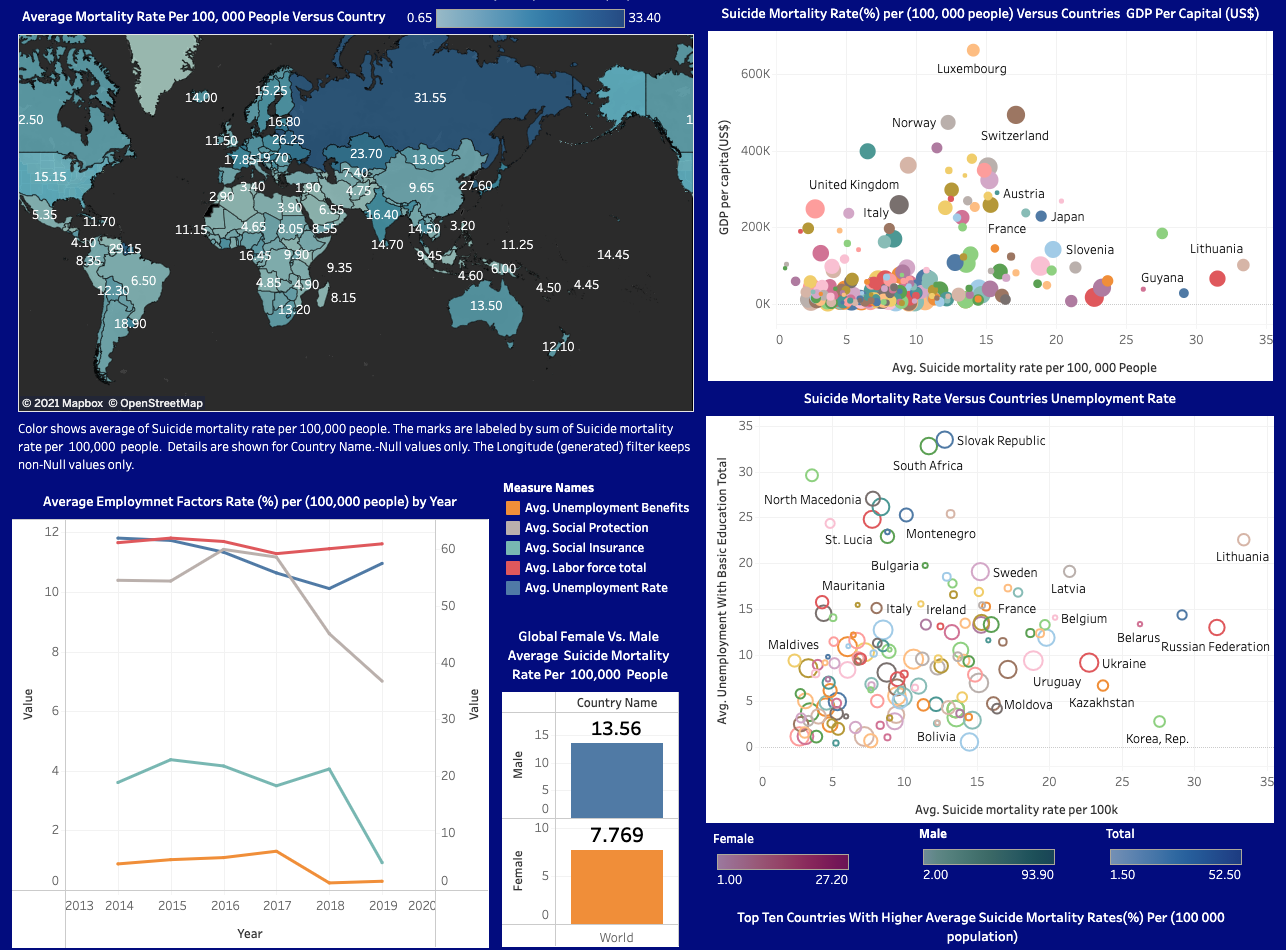
Population-level analysis of mental health and socio-economic indicators related to suicide mortality across countries to support prevention planning and public health insights.
Conducting data analysis and providing strategic insights to drive business decisions.
Conducted research and extracted business data to acquire new customers across a range of industries using internal tools and external data sources.
Conducted data research, sentiment analysis, and provided recommendations to governmental agencies on public complaints and social media engagement.
Hands-on training in machine learning, advanced analytics (Python, R, SQL), database management, data visualization, and statistical modeling. Experienced in applying data science to solve business problems, drive insights, and build ethical, real-world AI solutions.
For 24 weeks, I immersed myself in a data visualization and analytics program. The program equipped me with the skills and tools to work with large datasets and generate data-driven insights.
Research-focused Master's course in Cognitive Neuroscience
Psychological sciences and techniques for the analysis and evaluation of behavioral processes